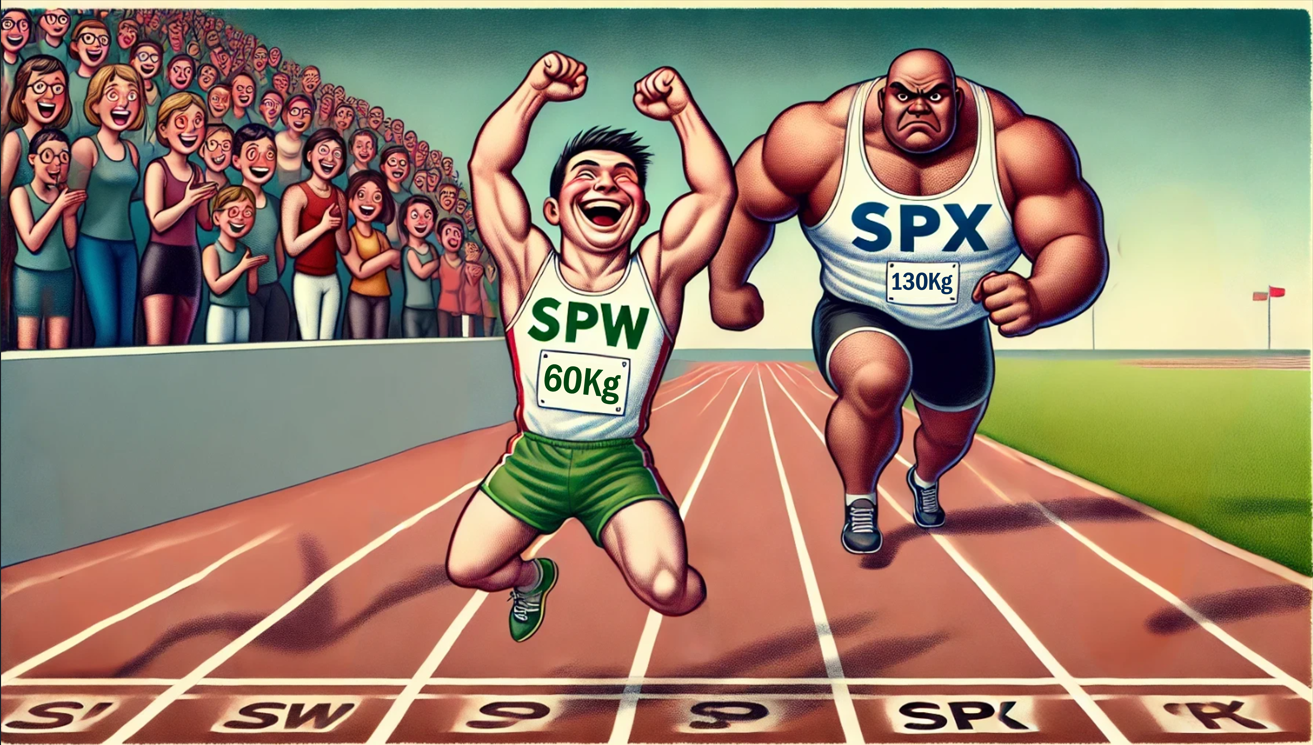
The 60-kilo guys
03 July 2024
Let's start with a little riddle this week: it's January 1, 1971, and I suggest you invest $100:
- Either in the classic S&P 500 - the SPX - (each company weighs its relative weight in the index)
- Or in its "equal weighted" version - the SPW - (each company weighs 0.2%, rebalancing each quarter)
What are you having?
Instinctively, I would have gone for the classic version, which was obvious to me... And I would have got it wrong. Luckily, I wasn't born in '71.
100 invested in the SPX at that time, gives $6,000 today. The same amount invested in the SPW is $12,000.
Not a straw's worth of difference.
In graphical form, it looks like this:
SPX- SPW
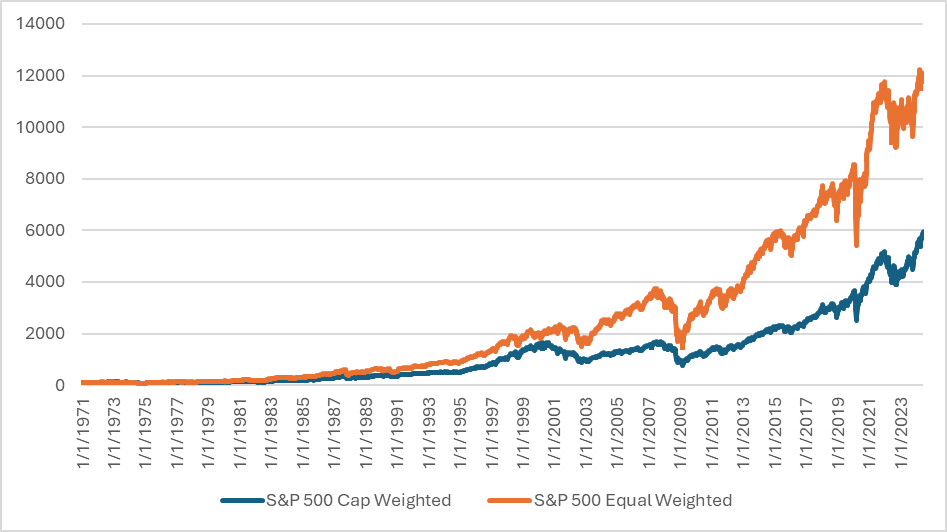
Source: Reuters
You're going to say to me "Well, Antoine, it depends on the departure date...". Well, yes, but not quite. If you look at the 2,200+ 10-year periods over the whole period, you can see that the SPW has outperformed on more than 1,800 of them. 80% of the time, the SPW has outperformed the SPX over 10 years.
There are two main reasons for this: 1/ greater exposure to smaller companies, and 2/ equal exposure across all companies in the same sector. Basically, the SPW is doing better because it is betting proportionally more on the challengers than on the favourites. « When guys weighing 130 kilos say certain things, those weighing 60 kilos listen. » Obviously, for shares, it's not the same thing.
So what happens when the SPX outperforms 20% of the time? There have been two such periods. The first was at the end of the 90s, and the other is the one we're in now (starting in January 2020). Logically, during these periods, it's the biggest caps that perform best, and just as logically, this leads to greater concentration in the SPX. In 1999, the 30 largest caps made up 43% of the index, today it's 53%.
A corollary is that when we look at the correlation graph (in green below) between the SPX and the SPW, we see thatit is usually above 0.9. In particular, it fell in 1998-99, when the SPX was up 52% and the SPW up 21%, and in 2000-2001, when the SPX was down 22% and the SPW up 6%. Today we are below 0.7, an unprecedented level. Since the start of 2023, the SPX has gained 43% and the SPW 15%.
SPX- SPW correlation (26 weeks)
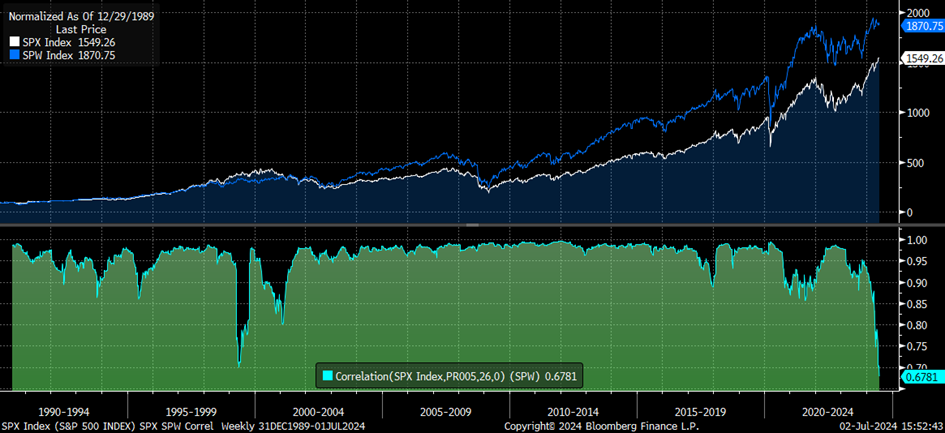
Source: Bloomberg
So what do we make of all this? 1/ Everyone is and goes into the same stocks, exacerbating the trend, 2/ historically the SPW has outperformed the SPX, the current period is an anomaly, and 3/ the SPX/SPW correlation is a rubber band and will rise above 0.9 again. I'll take bets: over the next few years, the SPW will outperform the SPX - the 60-kilo guys will do better than the 130-kilo guys. It's going to be a stock pickers' market. And that's just what we do at Monocle.
Market and portfolio focus
Behaviour:
Mired in investors' pre-election considerations, the CAC 40 lost 2% last week. For our part, we lost 0.5%, slightly more than the S&P 500 (-0.1%).
Paradoxically, it was our US stocks that moved the most this week. Aurora returned 35 bps thanks to the launch of a programme with Uber. On Capri, some are beginning to recognise that the gap between the share price and the takeover price (+75%) is too wide to ignore. +17 bps for us this week.
On the negative side, Five Below was hit by fears about the US consumer, costing us 24 bps. Lululemon fell on the back of the Nike report (-18 bps).
Lines:
No change in equities this week. On the other hand, we had taken a position in Bunds futures before the elections, to protect ourselves against a surprise result. However, this scenario did not materialise and we cut the position yesterday.
We also resumed a position in US long interest rate futures. Inflation levels continue to fall while US 30Y rates remain high (>4.6%). We have 32% exposure on this line.
Our gross equity exposure remains at 53% (net 40%) and our corporate credit exposure at 13%.
Have a great week,
Antoine
Disclaimer
This presentation is a promotional document. The content of this document is communicated by and is the property of Monocle Asset Management. Monocle Asset Management is a portfolio management company approved by the Autorité des Marchés Financiers under number GP-20000040 and registered with the ORIAS as an insurance broker under number 10058146. No information contained in this document should be construed as having any contractual value. This document is produced for information purposes only. The prospects mentioned are subject to change and do not constitute a commitment or a guarantee. Access to the products and services presented here may be subject to restrictions for certain persons or countries. Tax treatment depends on individual circumstances. The fund mentioned in this document (Monocle Fund SICAV) is authorized for marketing in France and possibly in other countries where the law permits. Before making any investment, it is advisable to check whether the investor is legally entitled to subscribe to the fund. The risks, costs and recommended investment period of the funds presented are described in the KIDD (key investor information documents) and the prospectus, available free of charge from Monocle Asset Management and on the website. The KIDD must be given to the subscribers before the subscription. Past performances are not a reliable indicator of future performances. Monocle Asset Management cannot be held responsible for any decision taken or not taken on the basis of information contained in this document, nor for the use that could be made by a third party. The investor may lose all or part of the amount of capital invested, as the funds are not capital guaranteed.
To unsubscribe or for any information request, you can email us at monocle@monocle.lu